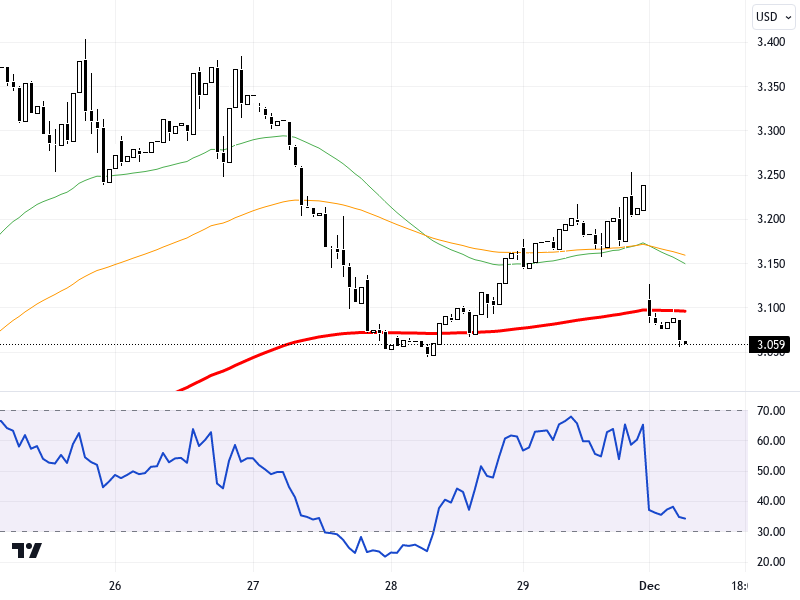
NGCUSD
The NGC/USD natural gas pair came under pressure last week due to mild weather conditions and increased production expectations and started the new week with a loss of about 5%. The performance of the US and European stock markets is among the key factors that could influence natural gas pricing. The strengthening of the US dollar and developments in global markets could also impact natural gas prices. As the Caixin manufacturing PMI data exceeded expectations and signaled an expansion in the Chinese economy, this supports the dollar, which could indirectly affect energy prices.
From a technical standpoint, movements in the NGC/USD chart are tracked in the hourly timeframe. The pair could encounter resistance at the 3.215 - 3.26 - 3.295 levels, while the 3.15 - 3.125 - 3.1 levels can be followed as support. The RSI indicator, exhibiting a negative outlook close to the oversold region, indicates that the selling pressure might continue. For the pair, which recorded a 5.53% decline compared to the previous day, sustained movements above the 3.295 resistance might be necessary to show signs of recovery in the short term.
Support :
Resistance :


