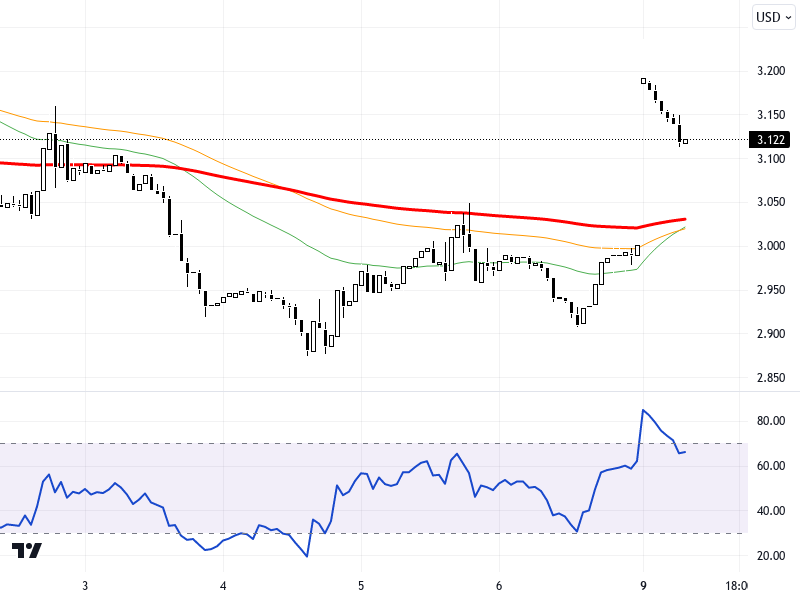
NGCUSD
US natural gas futures made a strong start to the new week with a rise in export demand. The stagnation in Asian markets and the flat course of US stock futures could lead to fluctuations in natural gas prices. The daily course of European and US markets may be decisive for the direction of natural gas prices. In light of these developments in global markets, natural gas prices may show an upward trend as long as they hold at certain critical levels.
Technically, the NGCUSD pair is trading at the 3.120 level. Resistance points to watch on the chart, evaluated in a 4-hour time frame, stand out at levels 3.1, 3.125, and 3.15. Support levels are determined as 3.04, 3.01, and 2.975. The RSI indicator is at the 60 level, displaying a positive outlook. The pair recorded a 3.97% increase compared to the previous day, indicating the upward movement is gaining momentum.
Support :
Resistance :


