WTIUSD
According to the statement from the US Energy Information Administration, the ongoing decline in inventories for eight weeks continues, putting upward pressure on oil prices. The slowing core inflation in the US and expectations of potential interest rate cuts by the Fed are also positively influencing the markets. Movements in European and US stock markets may also have an impact on the direction of oil prices.
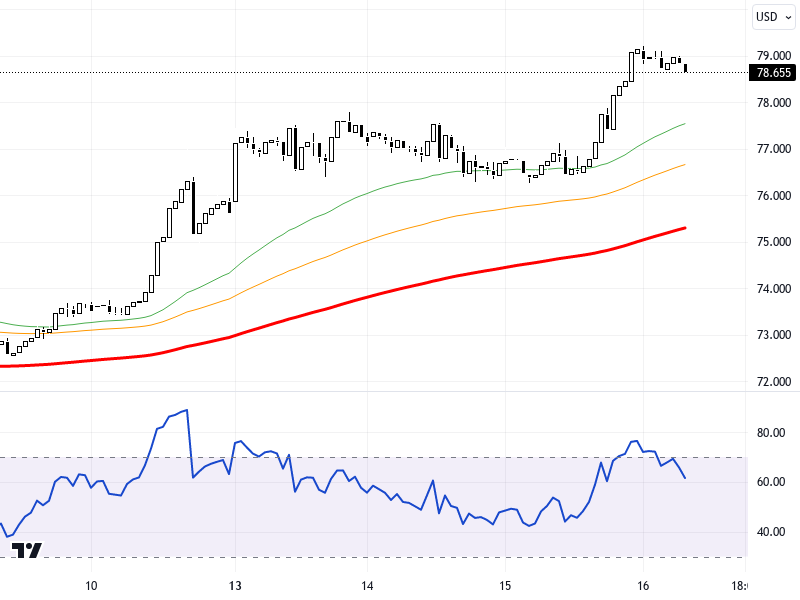
When examining the WTIUSD chart on a 4-hour time frame, it is observed that the price is trading around the 78.00 - 78.50 support zone. In upward movements, the levels of 79.50 and 80.00 can be monitored as resistance, while in possible declines, if the 78.00 - 78.50 support is broken, the levels of 77.50 and 77.00 could be tested. The RSI indicator is at the level of 48, displaying a neutral outlook. WTIUSD has experienced a 0.35% decrease compared to the previous day.
Support :
Resistance :