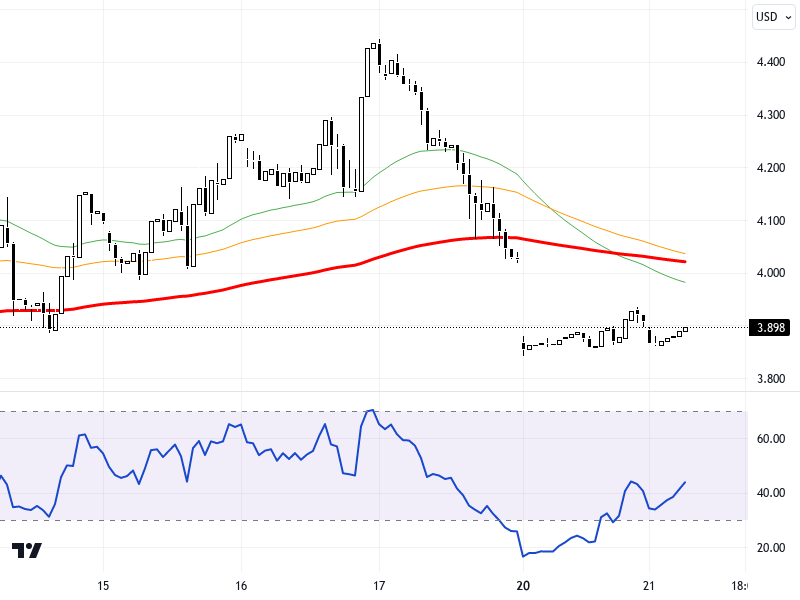
NGCUSD
U.S. natural gas futures were limitedly affected by the Trump administration's sanctions decisions on Canada and Mexico. While Trump's new tariff policies increased costs in sectors like automotive and weakened the Canadian dollar and Mexican peso, natural gas prices began the week with losses due to moderate weather forecasts. Therefore, the impact of these developments in the U.S. natural gas market remains mostly secondary. Canada's inflation data and its impact on monetary policy could also indirectly affect natural gas demand.
In the chart, the NGCUSD pair is trading in a tight range between 3.360 and 3.470. Hourly closings above 3.470 could trigger upward potential, indicating a move towards resistance levels at 3.520 and 3.570. On the downside, if the 3.360 support is broken, a move towards 3.295 and 3.215 levels may be observed. The RSI indicator is at 70 and exhibits a positive outlook. However, the pair has recorded a decline of 0.26% compared to the previous day.
Support :
Resistance :


