NGCUSD
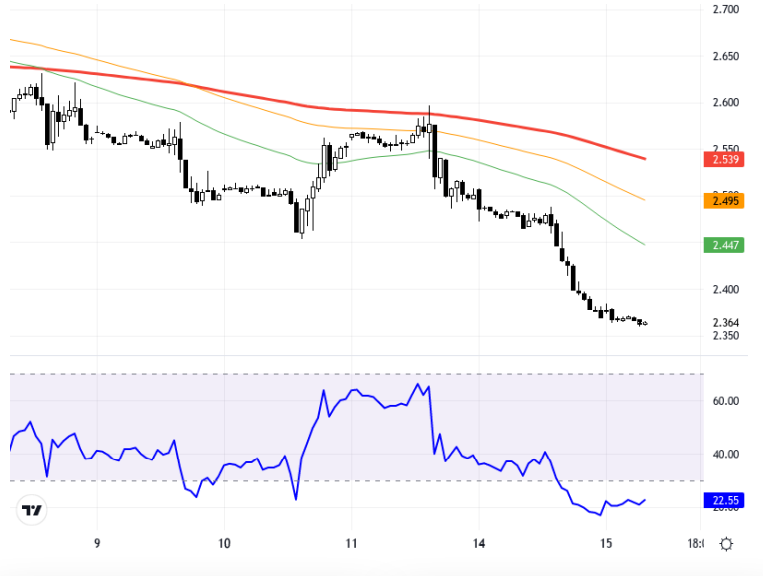
U.S. natural gas futures started the week with a decline due to expectations of weak demand following Hurricane Milton. The course of European and U.S. markets can also influence pricing. As long as prices remain below the resistance level of 2.610 - 2.650, a downward trend may dominate the market. In case of downward movements, the levels of 2.540 and 2.505 may be targeted, while in possible recoveries, breaching the 2.610 - 2.650 resistance zone might be necessary. To continue upward movements, it is expected to test above 2.650 and see it in hourly closes. The chart is in a 1-hour time frame, with levels of 2.54, 2.505, and 2.475 identified as support. Resistance levels appear to be 2.61, 2.65, and 2.675. The RSI indicator is at 33.41, indicating a negative trend. It has been observed to have increased by 0.12% compared to the previous day. The current price is 2.389. Support:2.44 - 2.41 - 2.38 - Resistance:2.505 - 2.54 - 2.58 -
ABD doğal gaz vadeli işlemleri, Milton Kasırgası sonrası talep zayıflığı beklentileriyle haftaya düşüşle başladı. Avrupa ve ABD borsalarının seyri de fiyatlamalar üzerinde etkili olabilir. Fiyatlamalar, 2,610 – 2,650 direnci ve altında kaldığı sürece piyasada aşağı yönlü bir görünüm baskın olabilir. Düşüş hareketlerinde 2,540 ve 2,505 seviyeleri hedeflenebilirken, olası toparlanmalarda 2,610 – 2,650 direnç bölgesinin aşılması gerekebilir. Yükselişlerin devamı için 2,650’nin üzerinin test edilmesi ve saatlik kapanışlarda görülmesi beklenebilir. Grafik 1 saatlik zaman diliminde olup, 2.54, 2.505 ve 2.475 seviyelerinin destek olarak izlenebileceği belirlenmiştir. Direnç seviyeleri ise 2.61, 2.65 ve 2.675 olarak gözükmektedir. RSI göstergesi 22 seviyesinde bulunup, negatif bir eğilime işaret etmektedir. Önceki güne göre %0.12 artış göstermiştir. Güncel fiyat 2.389'dir. Destek:2.44 - 2.41 - 2.38 - Direnç:2.505 - 2.54 - 2.58 -