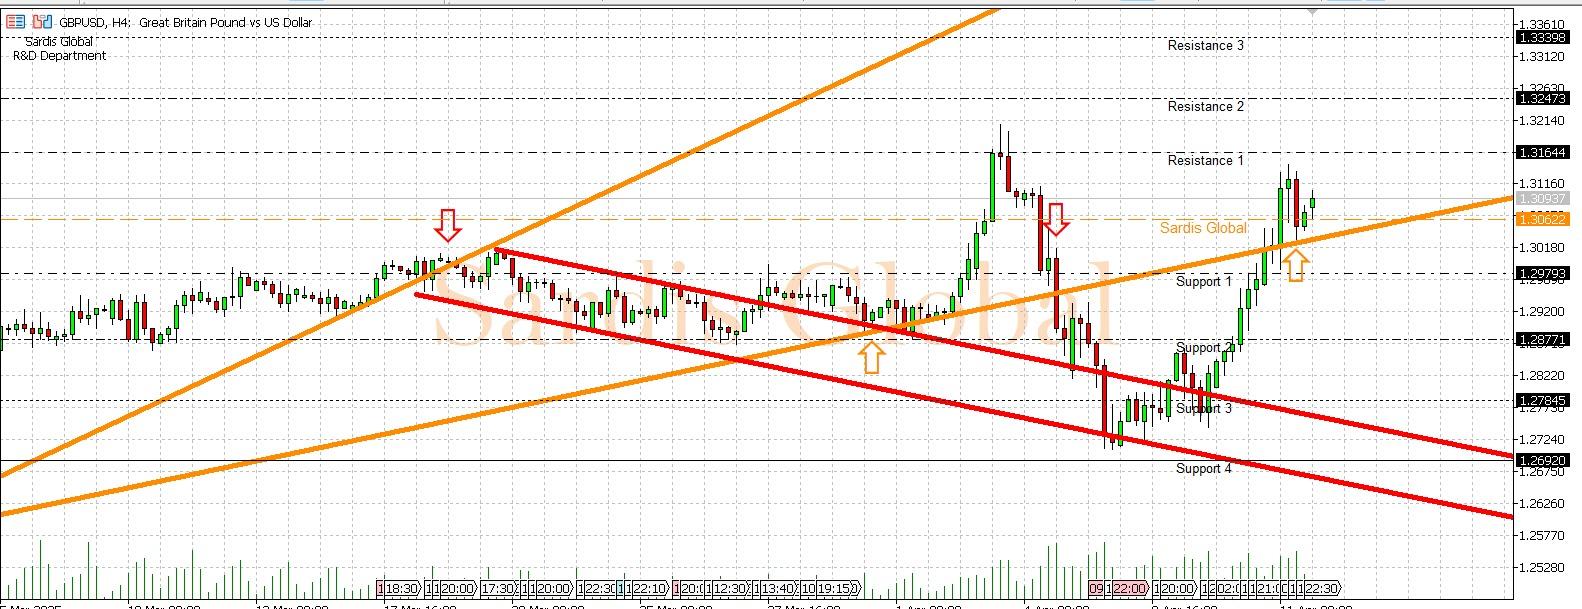
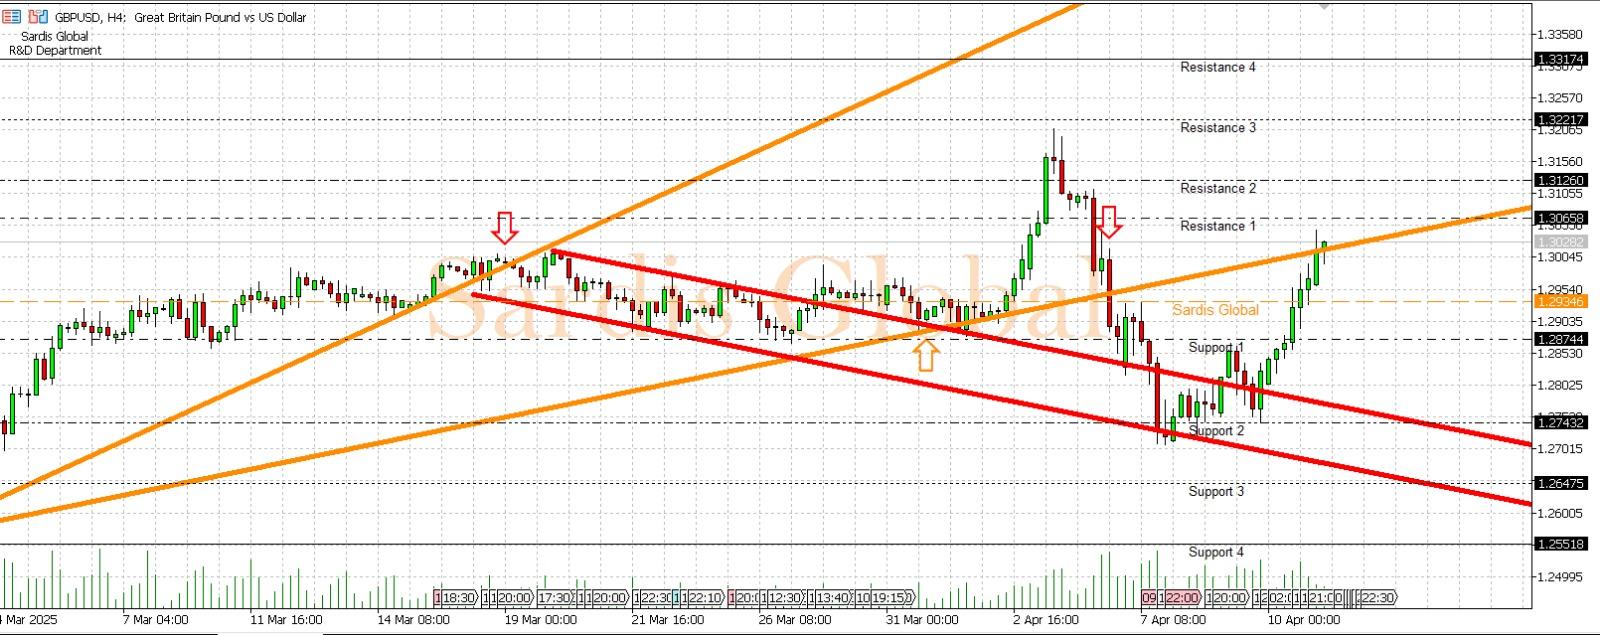
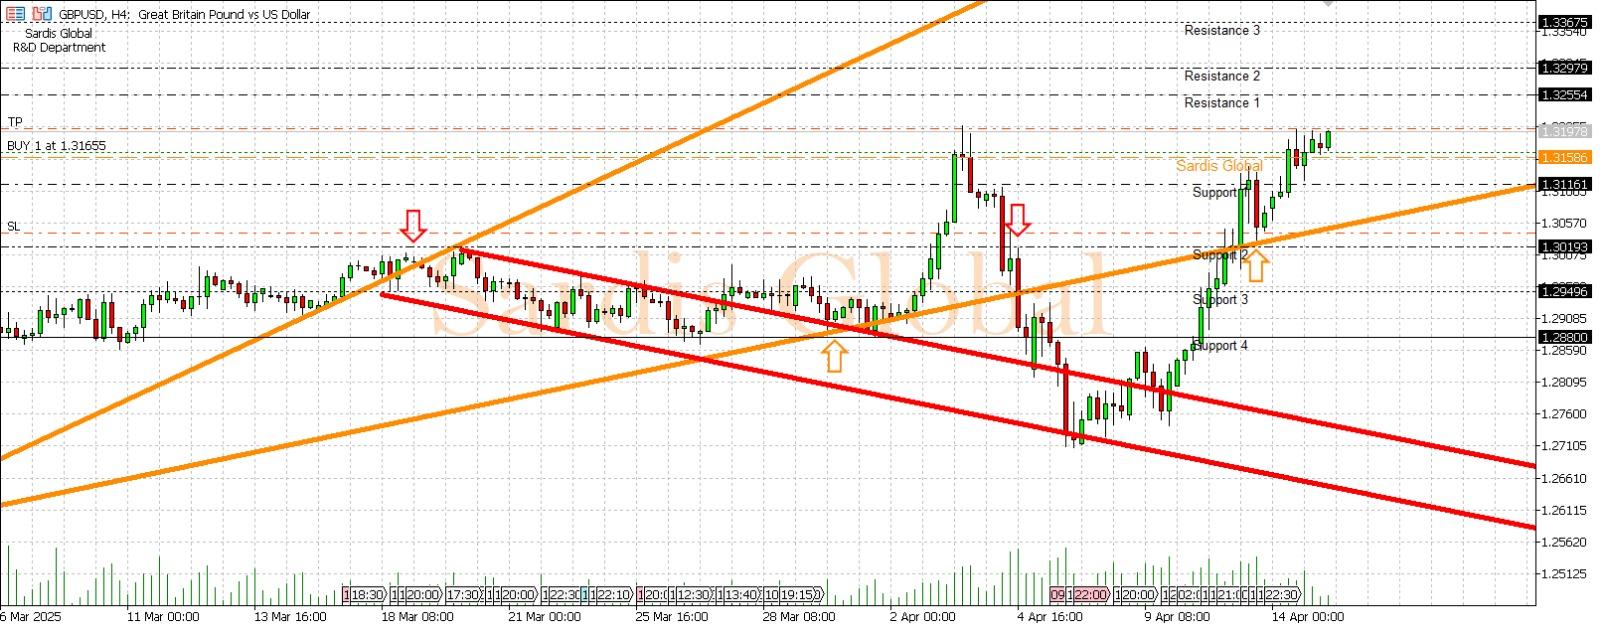
Technical Analysis

image
04 Apr 2025 04:02

GBPUSD

Daily Newsletter

The main direction in the GBPUSD pair is still up in the daily time frame. We stated that we could see a test of the 1.2599 level. Indeed, this contact also o...

Read More
image
04 Apr 2025 04:02

USDJPY

Daily Newsletter

USDJPY pair showed weakness before reaching 136.10. Price pulled back to 200-day average support area. If 133.90 area is lost and closed below, a pullback to ...

Read More
image
04 Apr 2025 04:02

XAUUSD

Daily Newsletter

Ons gold side, the EMA10 average is still regularly relied on in the daily time frame. The price continues to make daily closings above this average. 2022...

Read More
image
04 Apr 2025 04:02

WTI

Daily Newsletter

WTI CRUDE Oil had made a sharp decline until the liquidity at the local bottom. A reaction increase occurred around 72.30, which was within our expectation. A...

Read More
image
04 Apr 2025 04:02

BRENT

Daily Newsletter

BRENT Oil continued its sharp decline to the local bottom area. Roughly, the next day's closings below the 72 band will trigger the continuation of the declin...

Read More
image
04 Apr 2025 04:02

NASDAQ

Daily Newsletter

On the Nasdaq side, the 13360 level that we mentioned as two important targets has been reached. The price is still maintaining its upward momentum. 13450 l...

Read More
image
04 Apr 2025 04:02

DAX

Daily Newsletter

There was a pullback to the daily imbalance zone on the DAX side. The price still seems to be accelerating. As long as the zone expressed by the 15932-15826 l...

Read More
image
04 Apr 2025 04:02

Bitcoin

Daily Newsletter

Bitcoin experienced a sudden rise yesterday followed by a deep fall. There is a level we have determined to follow the strength of the price. It has passed be...

Read More
image
04 Apr 2025 04:02

NGAS

Daily Newsletter

We observed that the active demand zone on the Natural Gas side is the 4-Hour OrderBlock structure. The blue box represents a strong zone. We had stated that ...

Read More
image
04 Apr 2025 04:02

EURUSD

Daily Newsletter

If we look at the EURUSD parity on the daily chart, we will see that it is still moving above the averages and maintaining its main uptrend. The 1.0960 and 1....

Read More
image
04 Apr 2025 04:02

GBPUSD

Daily Newsletter

GBPUSD parity also tested the upper limit of the imbalance we pointed out in the 4-hour time frame. The short-term uptrend target has been completed. The box ...

Read More
image
04 Apr 2025 04:02

USDJPY

Daily Newsletter

USDJPY had previously exceeded the 200-day exponential average area, where it was subject to a sharp sell-off. It then tested the 135.14 level and completed t...

Read More
image
04 Apr 2025 04:02

XAUUSD

Daily Newsletter

Ounce gold came below the EMA20 average on the last day of the week. This is a short-term sell signal for us. The resulting weakness may take the price to the...

Read More
image
04 Apr 2025 04:02

WTI

Daily Newsletter

WTI CRUDE Oil showed the pullback we targeted. However, it could not give enough reaction from the 4-Hour EMA200 area. It will probably pull back towards the ...

Read More
image
04 Apr 2025 04:02

EURUSD

Daily Newsletter

EURUSD actually gave a clear signal of weakness when it lost its 20-day exponential average. The price has fallen to the averages we mentioned. If the day clo...

Read More
image
04 Apr 2025 04:02

Brent

Daily Newsletter

BRENT Oil fell as expected. It could not find support from the moving averages area. It seems likely that the decline will continue towards the 79.90 area, wh...

Read More
image
04 Apr 2025 04:02

GBPUSD

Daily Newsletter

GBPUSD parity also experienced a sharp decline parallel to EURUSD. This decline continued until the EMA20 level, which we consider as an important support. If...

Read More
image
04 Apr 2025 04:02

Nasdaq

Daily Newsletter

Nasdaq has lost the 4-Hour EMA100 area. The price's upward momentum seems to have weakened. In the short term, we may see a pullback to the 12880 area. If the...

Read More
image
04 Apr 2025 04:02

USDJPY

Daily Newsletter

USDJPY pair showed weakness before reaching 136.10. Price pulled back to 200-day average support area. If 133.90 area is lost and closed below, a pullback to ...

Read More
image
04 Apr 2025 04:02

DAX

Daily Newsletter

DAX has returned to a key demand zone. As long as the price remains above 15830, it will have the potential to turn upwards. If it settles below 15830, we wil...

Read More
image
04 Apr 2025 04:02

XAUUSD

Daily Newsletter

Ounce gold is struggling to hold on to the 20-day exponential average support. If the average, which has been tested many times before, is broken this time an...

Read More