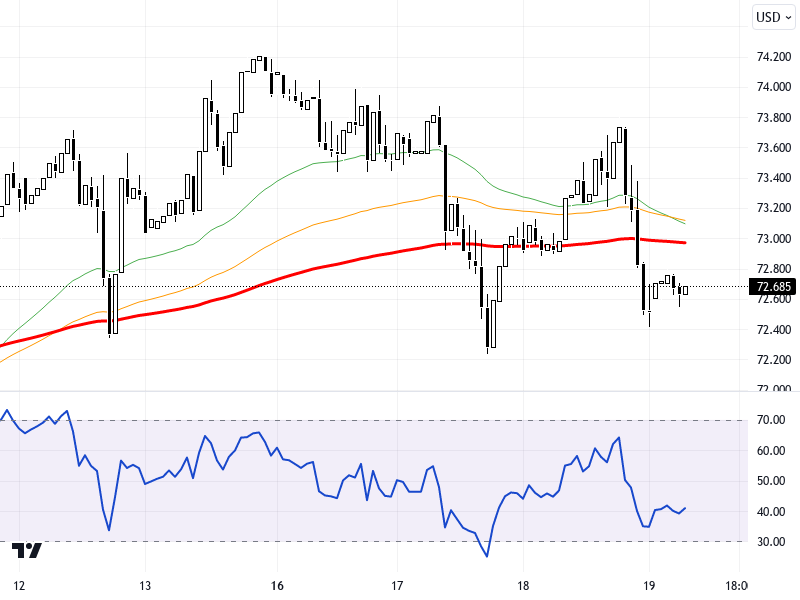
BRNUSD
Oil markets are under the influence of a sharp rise in the dollar due to the Fed's projection of fewer rate cuts next year, despite the recent rate cut. This situation creates downward pressure on oil prices. Additionally, expectations of an increase in non-OPEC production further intensify the downward pressure on prices. Although the U.S. Energy Information Administration's announcement of a decline in inventories provides some support, oil prices are generally on a downward trend alongside weakening demand.
According to technical chart analysis, the BRN/USD pair is trading below the 72.75 – 73.00 resistance zone. If the downward movements continue, the levels of 72.4, 72, and 71.5 can be monitored as support. In the event of an upward momentum, the resistance levels of 72.75 and 73.00 should be noted. On the daily chart, the RSI indicator is at the 49 level, presenting a neutral outlook. The pair shows signs of slight recovery with a 0.23% increase compared to yesterday's close. However, overall downward pressures persist.
Support :
Resistance :


