WTIUSD
WTI crude oil prices are trending downward due to negative expectations regarding global demand. The U.S. Energy Information Administration's prediction that global oil supply will exceed demand supports this decline, while the American Petroleum Institute's announcement of a less-than-expected drop in stockpiles also pressures prices. In this process, the CPI data to be released in the U.S. along with the Energy Information Administration's stock reports should be closely monitored. The mixed course in global markets and the impact of U.S. inflation data on Fed expectations could play a significant role in oil prices.
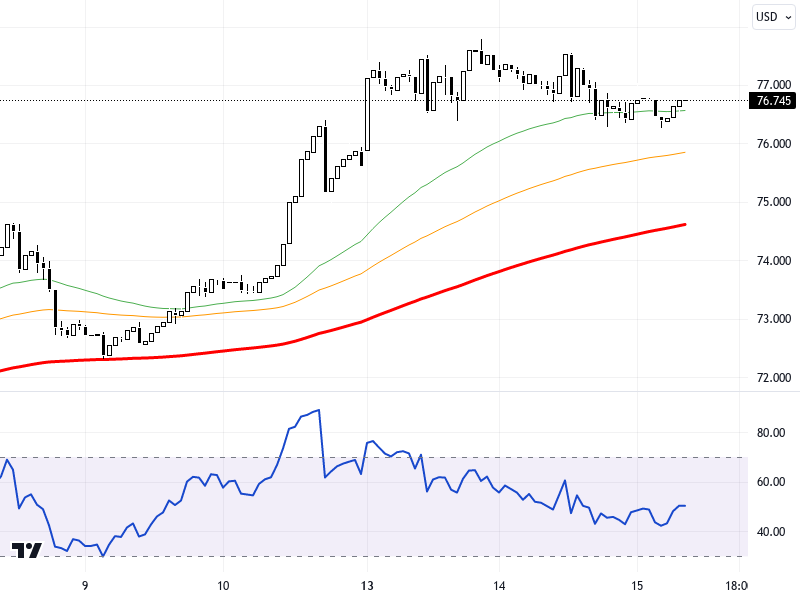
Technically, when examining the WTIUSD chart on an hourly time frame, it is observed that the price is moving below the 76.50 - 77.00 resistance zone. In the continuation of the downward movement, the levels of 76.00, 75.50, and 75.00 can be monitored as support, respectively. In the case of an upward recovery, the resistance levels of 77.00, 77.50, and 78.00 remain valid. The RSI indicator is at the 47 level, exhibiting a neutral outlook and not signaling a significant directional change in the market. A 0.03% decrease in price compared to the previous day has been recorded.
Support :
Resistance :