EURUSD
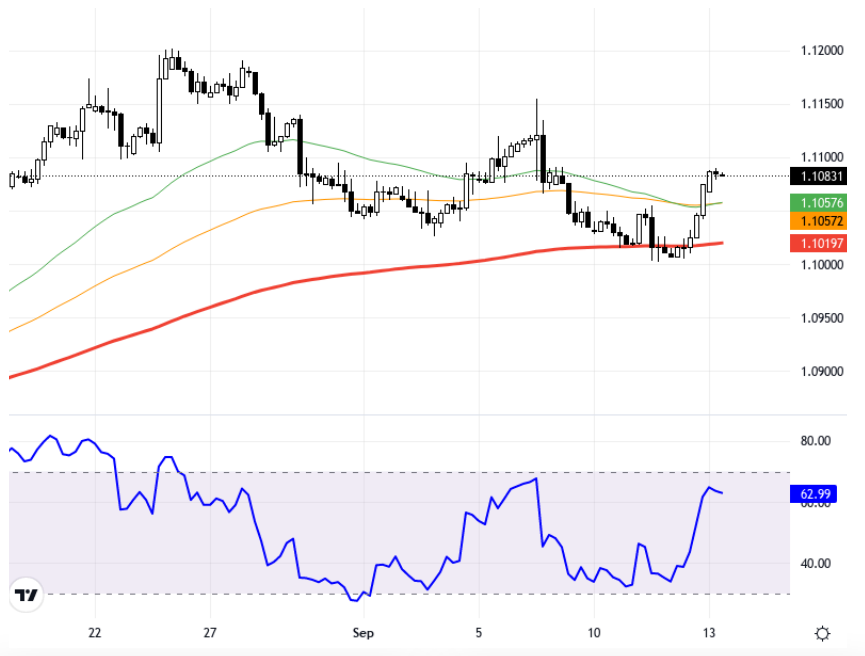
The EURUSD pair has shifted the market's attention to the Fed meeting on September 18, after recent significant developments such as the HarrisTrump TV debate, US CPI, and ECB interest rate decisions. While a 25 basis point rate cut is expected at this meeting, speculations about a possible 50 basis point cut continue. Interest rate decisions, economic projections, and Fed Chairman Powell's messages will be critical for global market pricing next week. On the other hand, Eurozone industrial production and US Michigan Consumer Sentiment data may also affect the pair's short-term movement. Technically, examining the 4-hour chart, the EURUSD pair is priced at the 10805 level. The pair is trying to test the resistance area at the 1.1057 level, while 1.099 and 1.094 levels are monitored as support in downward movements. The RSI indicator is at 62.95, showing a positive trend. However, the -0.01% change compared to the previous day indicates a slight pause in the short term. The current price is moving close to the support and resistance levels of the technical indicators, and these levels observed in the charts need to be monitored for the pair's future movements. Support:1.099 - 1.094 - 1.09 - Resistance:1.1057 - 1.11 - 1.1145 -
EURUSD paritesi, son dönemde Harris – Trump TV tartışması, ABD TÜFE ve ECB faiz kararları gibi önemli gelişmeleri geride bırakarak piyasaların dikkatini 18 Eylül’deki Fed toplantısına çevirmiş durumda. Bu toplantıda 25 baz puanlık faiz indirimi beklenirken, toplantıdan çıkacak olası 50 baz puanlık indirim konusunda spekülasyonlar da sürüyor. Faiz kararları, ekonomik projeksiyonlar ve Fed Başkanı Powell’ın mesajları önümüzdeki hafta küresel piyasalardaki fiyatlamalar için kritik olacak. Diğer yandan Euro Bölgesi sanayi üretimi ve ABD Michigan Tüketici Hissiyatı verileri de paritenin kısa vadeli hareketine etki edebilir. Teknik olarak 4 saatlik grafik incelendiğinde, EURUSD paritesi 1,0805 seviyesinde fiyatlanıyor. Parite, 1,1057 seviyesindeki direnç bölgesini test etmeye çalışırken, aşağı yönlü hareketlerde 1,099 ve 1,094 seviyeleri destek olarak izleniyor. RSI göstergesi 62.95 seviyesinde olup pozitif bir eğilim sergiliyor. Ancak önceki güne göre değişim yüzde -0.01, bu da paritenin kısa vadede hafif bir duraksama yaşadığını gösteriyor. Güncel fiyat, teknik göstergelerin destek ve direnç seviyelerine yakın seyrediyor ve grafiklerde gözlemlenen bu seviyeler parçanın gelecekteki hareketleri için takip edilmeyi gerektiriyor. Destek:1.099 - 1.094 - 1.09 - Direnç:1.1057 - 1.11 - 1.1145 -