WTIUSD
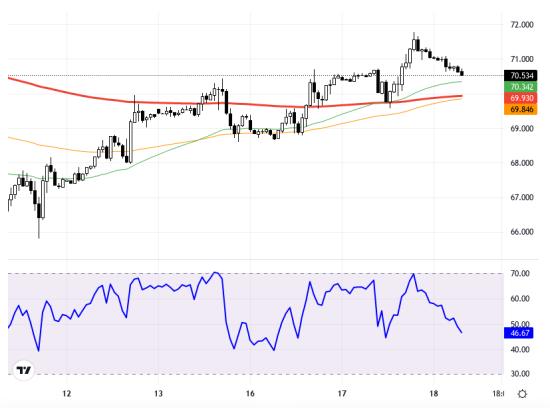
WTI crude oil prices faced profit-taking following their previous rise due to expectations of a Fed rate cut and geopolitical risks, as the American Petroleum Institute announced an increase in stocks. This situation has turned investors' attention to the stock figures to be announced by the U.S. Energy Information Administration and the Fed's monetary policy statement. It is observed that the 69.00 - 69.50 support zone plays an important role in pricing. If this support zone is maintained, it's anticipated that short-term upward expectations may strengthen. In the chart, we see that WTI prices are above the 69.84 support level on the hourly timeframe but encounter resistance toward the 70.50 resistance level. In sudden drops, the 69.00 and 68.50 levels can be monitored as support. The RSI indicator is at the 46.89 level, indicating a neutral but downward pressure. It is trading at 70.54 with a daily decrease of 0.13%. These indicators suggest that the selling pressure may continue, highlighting the importance of staying above the 69.50-70.00 region Support:69 - 68.5 - 68 - Resistance:70 - 70.5 - 71 -
WTI ham petrol fiyatları, Fed’in faiz indirimi beklentileri ve jeopolitik risklerin etkisiyle önceki yükselişinin ardından Amerikan Petrol Enstitüsü’nün stok artışı açıklamasıyla kâr satışlarına maruz kaldı. Bu durum, yatırımcıların dikkatini ABD Enerji Bilgi Dairesi'nin açıklayacağı stok rakamlarına ve Fed para politikası beyanatına çevirdi. Fiyatlamalarda 69,00 - 69,50 destek bölgesinin önemli bir rol oynadığı gözleniyor. Eğer bu destek bölgesi korunursa, kısa vadeli yükseliş yönlü beklentilerin güçlenebileceği öngörülüyor. Grafikte, saatlik zaman diliminde WTI fiyatlarının 69.84 destek seviyesi üzerinde olduğunu, ancak 70.50 direnç seviyesine doğru dirençle karşılaştığını görüyoruz. Ani düşüşlerde 69.00 ve 68.50 seviyeleri destek olarak izlenebilir. RSI göstergesi 46.89 seviyesinde olup, nötr ancak aşağı yönlü baskıyı işaret ediyor. Günlük bazda %0.13 düşüşle 70.54 seviyesinde işlem görüyor. Bu göstergeler, satış baskısının devam edebileceğine işaret ederken, 69.50-70.00 bölgesinin üzerinde kalmanın önemine dikkat çekiyor. Destek:69 - 68.5 - 68 - Direnç:70 - 70.5 - 71 -