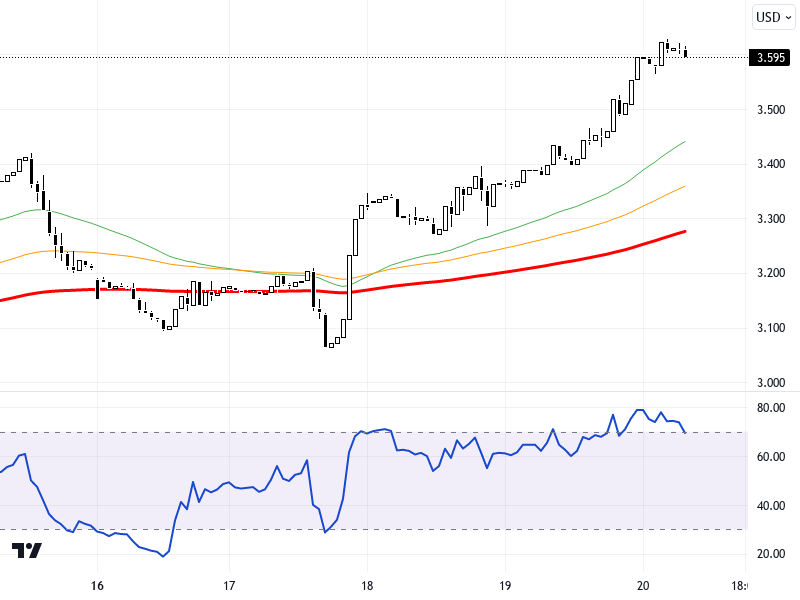
NGCUSD
U.S. natural gas futures continue to rise with expectations of increased global demand and statements from the U.S. Energy Information Administration about declining stocks. This situation is supported by the decrease in inventories for the fifth consecutive week. Additionally, developments in U.S. and European stock markets may also impact natural gas pricing. The cautious stance of Asian indices prior to inflation and inflation data from Japan could indirectly affect natural gas demand.
When examining the NGCUSD pair on a 4-hour chart timeframe, it is observed that pricing is trying to hold above the support levels of 3.295 and 3.26. Upward movements might continue towards resistance levels of 3.37 and 3.4. The RSI indicator is at the 50 level, presenting a neutral outlook. In the pair, which shows a slight decrease of 0.06% compared to the previous day, the level of 3.215 might come into focus if it falls below the support levels.
Support :
Resistance :


