NGCUSD
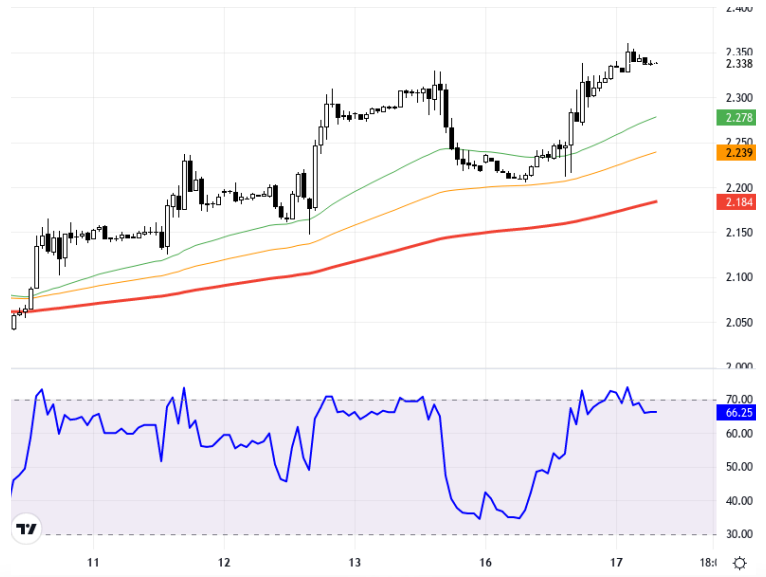
The NGC/USD pair is trading at its highest levels in nearly two months due to disruptions in production caused by the hurricane. Developments in European and US markets can closely affect the price movements of the pair. As long as current pricing remains above the 2.290 – 2.335 support levels, the upward trend is expected to continue. In upward movements, the 2.410 and 2.440 resistance levels can be targeted. However, if declines begin, closings below 2.290 could signal deeper pullbacks; in this case, the 2.250 and 2.215 levels should be monitored. When examining the chart, NGC/USD is trading on an hourly timeframe with the current price at the 2.338 level. The 2.290 and 2.278 levels appear as the nearest support zones, while the resistance levels are at 2.339 and 2.378. The RSI indicator is at 66.25, showing a positive trend. Compared to the previous day, the price change is positive with an increase of 0.19%. Within this analysis framework, the likelihood of upward movements taking precedence on a daily basis can be considered. Support:2.335 - 2.29 - 2.25 - Resistance:2.41 - 2.44 - 2.475 -
NGC/USD paritesi, kasırga nedeni ile üretimde yaşanan kesintilerin etkisiyle yaklaşık iki ayın en yüksek seviyelerinde işlem görüyor. Avrupa ve ABD borsalarındaki gelişmeler paritenin fiyat hareketlerini yakından etkileyebilir. Mevcut durumda fiyatlamalar 2,290 – 2,335 destek seviyeleri üzerinde kaldığı sürece, yukarı yönlü görünümün devam etmesi beklenebilir. Yukarı yönlü hareketlerde 2,410 ve 2,440 direnç seviyeleri hedeflenebilir. Ancak düşüşler başladığında 2,290 altındaki kapanışlar daha derin geri çekilmelerin habercisi olabilir; bu durumda 2,250 ve 2,215 seviyeleri izlenmelidir. Grafik incelendiğinde, NGC/USD saatlik zaman diliminde işlem görmekte ve mevcut fiyat 2,338 seviyesindedir. 2,290 ve 2,278 seviyeleri en yakın destek bölgeleri olarak gözükürken, direnç olarak 2,339 ve 2,378 seviyeleri bulunmaktadır. RSI göstergesi 66,25 seviyesinde ve pozitif bir eğilim göstermektedir. Önceki güne göre fiyat değişimi %0,19 artışla pozitif yöndedir. Bu analiz çerçevesinde, günlük bazda yukarı yönlü hareketlerin ön planda olması olasılığı değerlendirilebilir. Destek:2.335 - 2.29 - 2.25 - Direnç:2.41 - 2.44 - 2.475 -