NDXUSD
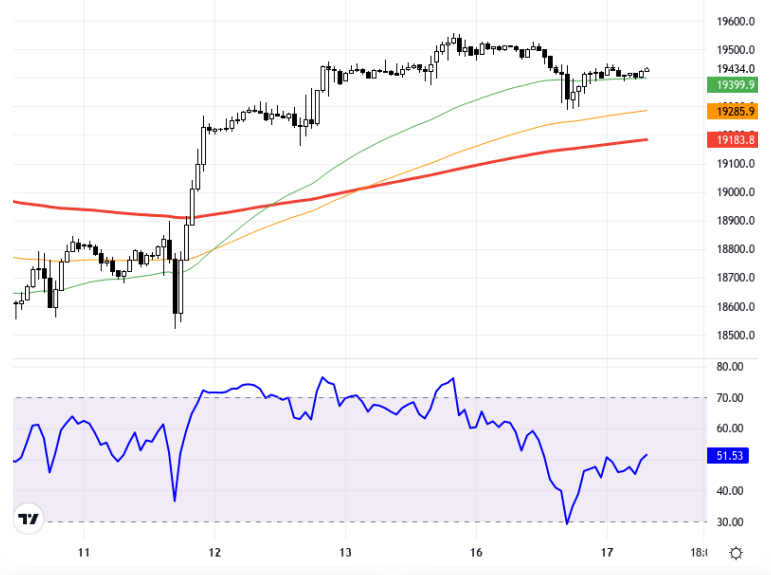
The NASDAQ100 index shows limited pricing with the anticipated interest rate cut in the Fed's statement tomorrow. While the index finds support with the decline in the 10-year treasury bond yields, retail sales data will be significant during the day. Meanwhile, a mixed trend is prominent in Asian markets, influenced by the weakness in the Chinese economy. Additionally, this week, central bank decisions from England, Japan, and some other countries will also be closely monitored along with the Fed's. From a technical analysis perspective, when the chart is examined on a 1- hour time frame, it is observed that as long as the index is trading above the 19400 - 19500 region, it maintains a positive outlook. If the index continues its upward momentum, resistance levels at 19700 and 19800 can be monitored. The RSI indicator is at 51.53 and shows a neutral stance. There is a slight increase of 0.05% compared to the previous day. The current price is determined as 19428.5. If the index falls below the 19400 level, it may create a movement area towards the support levels of 19300 and 19155. Support:19600 - 19500 - 19155 - Resistance:19700 - 19800 - 19900-
NASDAQ100 endeksi, Fed’in yarınki beyanatında beklenen faiz indirimi etkisiyle sınırlı fiyatlanma gösteriyor. Endeks, 10 yıllık hazine tahvil getirilerinin gerilemesiyle destek bulurken, perakende satışlar verileri gün içerisinde önemli olacak. Bununla birlikte, Asya piyasalarında Çin ekonomisindeki zayıflığın etkisiyle karışık bir seyir öne çıkıyor. Ayrıca, bu hafta Fed'in yanı sıra İngiltere, Japonya ve diğer bazı ülkelerin merkez bankası kararları da dikkatle izlenecek. Teknik analiz açısından, grafik 1 saatlik zaman diliminde incelendiğinde endeksin 19400 - 19500 bölgesi üzerinde işlem gördüğü sürece pozitif görünüm sergilediği gözlemleniyor. Endeksin yükseliş isteğini sürdürmesi durumunda 19700 ve 19800 direnç seviyeleri takip edilebilir. RSI göstergesi 51.53 seviyesinde ve nötr bir görünümde. Önceki güne göre %0,05'lik hafif bir artış mevcut. Güncel fiyat ise 19428.5 olarak belirlenmiş durumda. Endeksin 19400 seviyesinin altına düşmesi, 19300 ve 19155 destek seviyelerine doğru bir hareket alanı yaratabilir. Destek:19600 - 19500 - 19155 - Direnç:19700 - 19800 - 19900