NDXUSD
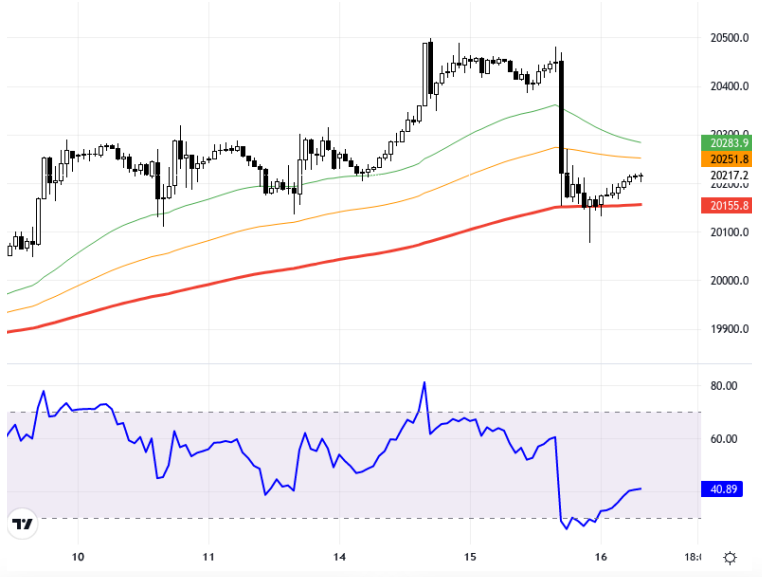
The NASDAQ 100 index is under pressure despite the movements led by technology stocks in the U.S. and the favorable earnings results of financial giants like JPMorgan and Wells Fargo, due to disappointment in Tesla's robotaxi presentation and the recovery of U.S. 10-year treasury bond yields. One of the important developments that will influence the direction of the index in the short term is the speech to be delivered by FOMC member Waller. Additionally, movements above the strategic area supported by the 21-period exponential moving average at the 20356 level may indicate the continuation of the upward trend. As long as the NASDAQ 100 index maintains stability above 20350 on the 1- hour chart, upward movements targeting resistance levels at 20500 and 20650 can be expected. The RSI indicator, notable on the chart, is at a neutral 52.45 level. The index is observed trading at 20217, with a slight decrease of 0.06% compared to the previous day. Alternatively, shortcomings below the 20250 level could lead to pullbacks to the 20150 and 20000 support levels. Support:20250 - 20150 - 20000 - Resistance:20500 - 20650 -20750 -
NASDAQ 100 endeksi, ABD’deki teknoloji hisselerinin liderliğindeki hareketler ve JPMorgan ile Wells Fargo gibi finans devlerinin olumlu bilanço sonuçlarına rağmen, Tesla’nın robotaksi tanıtımındaki hayal kırıklığı ve ABD 10 yıllık hazine tahvil getirilerindeki toparlanma ile baskı altında kalmış durumda. Endeksin yönü üzerinde kısa vadede etkili olacak önemli gelişmeler arasında FOMC üyesi Waller'ın yapacağı konuşma yer alıyor. Ayrıca, 20356 seviyesindeki 21 periyotluk üstel hareketli ortalamanın desteklediği stratejik bölge üzerindeki hareketler yükseliş eğiliminin devamına işaret edebilir. NASDAQ 100 endeksi 1 saatlik grafikte 20350 üzerinde kalıcılık sağladıkça, yukarı yönlü hareketlerin 20500 ve 20650 direnç seviyeleri hedeflenebilir. Grafikte dikkat çeken RSI göstergesi 52.45 seviyesinde ve piyasada nötr bir görünüm sergiliyor. Endeksin önceki güne göre %0.06’lık hafif bir düşüşle 20217 seviyesinde işlem gördüğü görülüyor. Alternatif olarak, 20250 seviyesinin altında kalınması durumunda, 20150 ve 20000 destek seviyelerine geri çekilmeler gözlemlenebilir. Destek:20250 - 20150 - 20000 - Direnç:20500 - 20650 -20750 -