NDXUSD
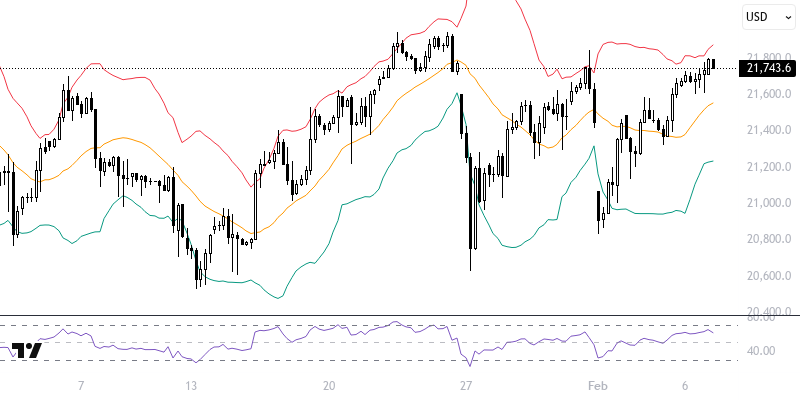
Despite the risk perception created by trade wars, the NASDAQ 100 Index showed an upward trend. The unexpected increase in unemployment claims contributed to the index's rise by leading to a decline in 10-year bond yields. Throughout the day, important data such as average hourly earnings, unemployment rate, non-farm payroll changes, and Michigan consumer sentiment are being closely monitored.
The NASDAQ 100 index is trading above levels with supportive indicators. In short-term technical analysis, as long as it continues to be priced in the range of 21600 – 21700, supported by the 21 (21697) and 89 (21586) period exponential moving averages, upward movements are expected to persist. If a positive trend continues, room for movement towards the 21900 and 22000 levels may emerge. For a bearish expectation, however, sustained pricing below the 21600 – 21700 region must be observed. In this case, there is a risk of encountering the 21500 and 21400 levels. The key levels of the day: 21600 – 21700 range.
Support :
Resistance :